API Key Observatory
The API Key Observatory is a read-only view of activity for one Pool API key. It is useful when a key holder needs to check recent usage, cost, models, or outcomes without receiving access to the instance administration workspace.
Dashboard access must be enabled for the key by the person who manages that key. It is separate from both runtime permission and the instance-admin browser session:
- The Pool API key continues to authenticate runtime requests through the configured
/backend-apior narrow/v1routes. - Dashboard access only permits this key to open the Observatory.
- Observatory access does not grant
/admin/*access, expose other keys, or change the key’s runtime policy.
Sign in
Section titled “Sign in”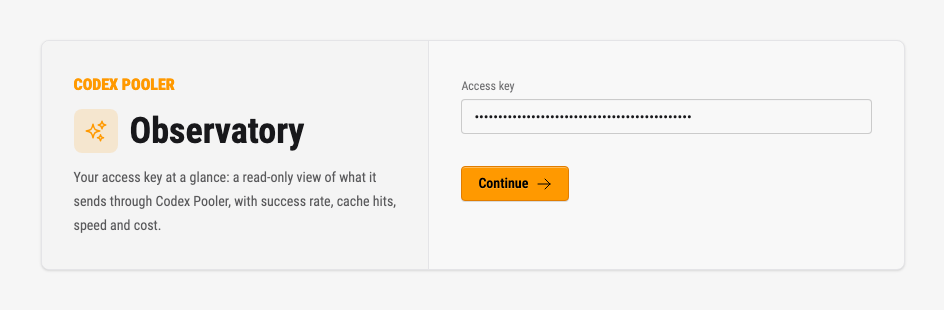
- Open
GET /observatory/login. - Enter the access key in the password-style form and choose
Continue. - A valid eligible key creates a separate browser session and redirects to
GET /observatory. - Choose
Log outin the Observatory when you are finished.
The access key is accepted in the form submission only. Do not place it in a URL or query string, and do not copy it into notes, screenshots, tickets, or browser storage. The Observatory does not show the raw key again.
What the Observatory shows
Section titled “What the Observatory shows”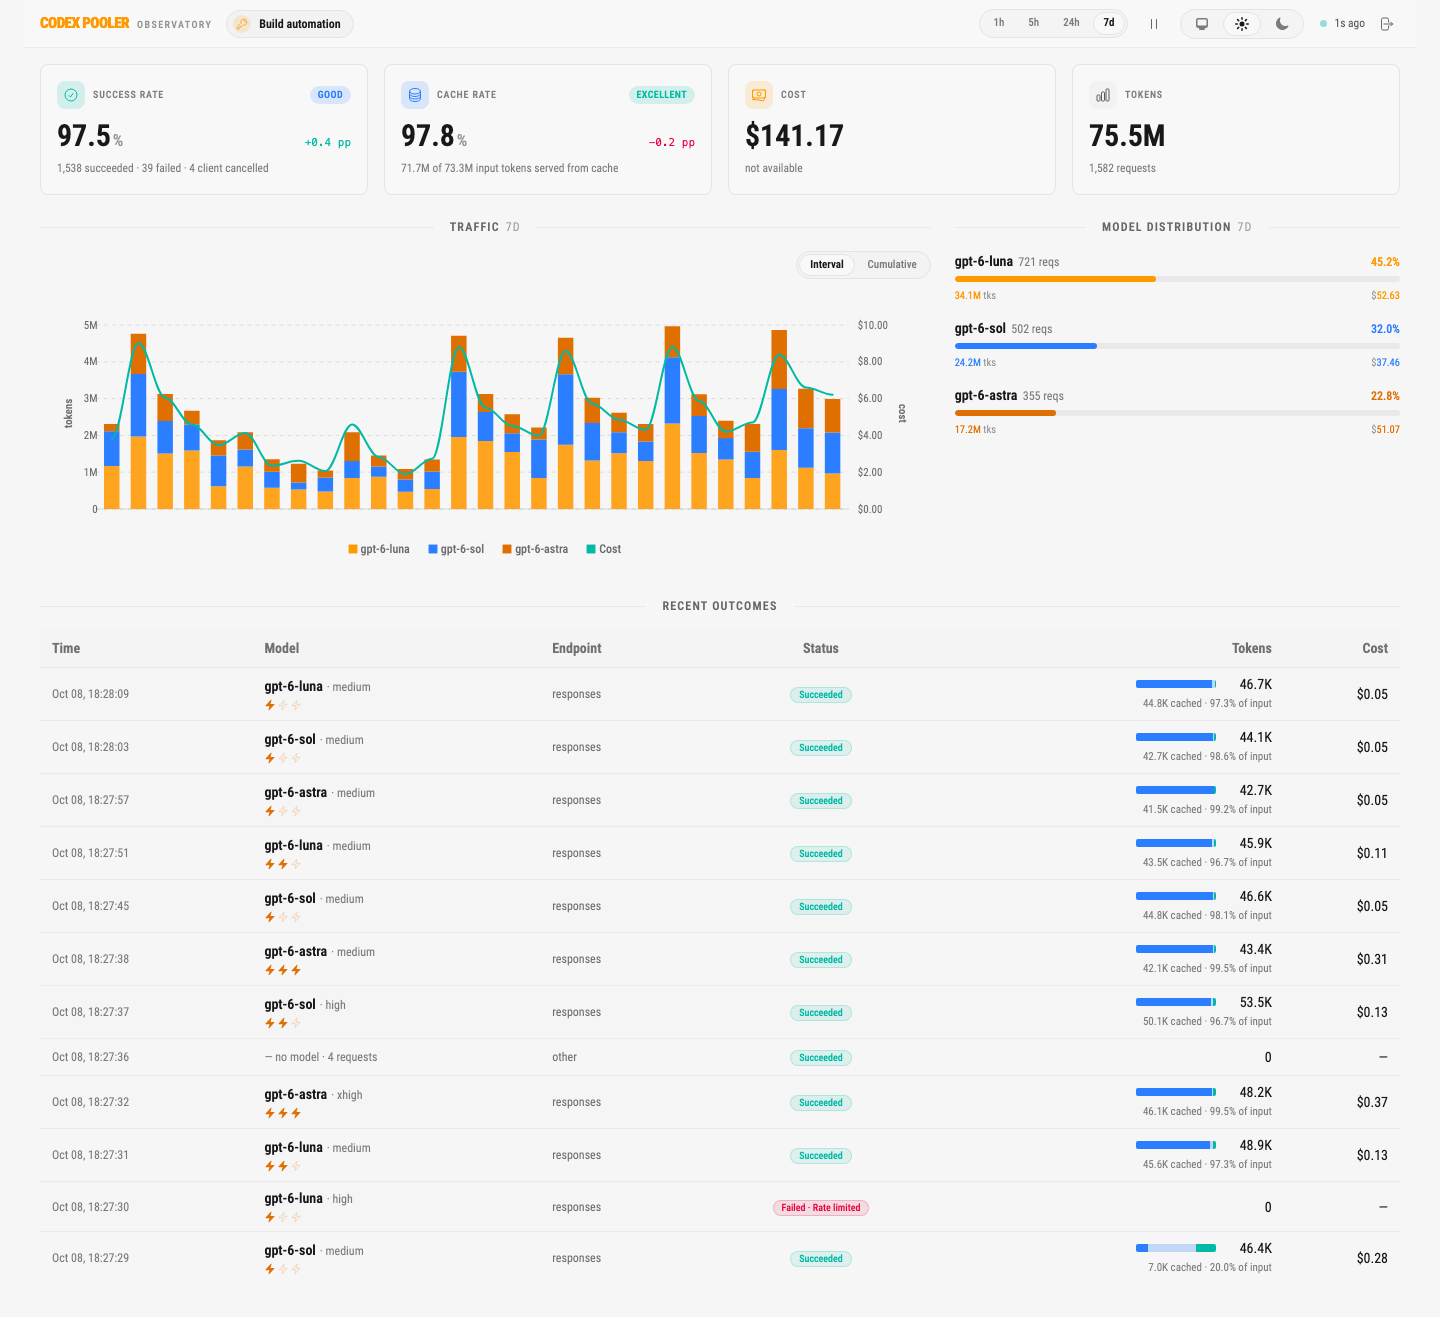
The toolbar names the key by its display name and holds the window switch, the pause and resume control for refresh, the theme switch, the time since the last update and Log out. The window is one of 1h, 5h, 24h (the default) or 7d, and everything below the toolbar covers that window.
Summary cards
Section titled “Summary cards”Four cards open the page:
- Success rate is the share of requests that succeeded. Its detail line counts the requests (
N succeeded · N failed) and adds the requests the client cancelled when there are any. - Cache rate is the share of input tokens served from cache, with the cached and total input tokens in its detail line.
- Cost is the settled cost of the window. The line under it adds
+ $N.NN estimated, awaiting settlementfor requests whose accounting is still completing and readsnot availablewhen there is nothing to estimate. - Tokens is the total token usage of the window, with the number of requests.
The first two cards carry a grade badge and a trend. The trend compares the second half of the window with the first half, in percentage points. The grade places the rate in a tier:
| Card | Excellent | Good | Fair | Lowest tier |
|---|---|---|---|---|
| Success rate | 99% or more | 95% to under 99% | 90% to under 95% | Poor, under 90% |
| Cache rate | 80% or more | 50% to under 80% | 25% to under 50% | Low, under 25% |
The tiers are reading aids, not service levels: a low cache rate only says that the prompts share little prefix.
Traffic and model distribution
Section titled “Traffic and model distribution”The Traffic chart plots tokens per time bucket as stacked columns, one colour per model (the five busiest models, with the rest folded into Other), and the cost of each bucket as a line on a second axis. Interval shows every bucket on its own and Cumulative shows running totals. A bucket spans five minutes on the 1h window, fifteen minutes on 5h, one hour on 24h and six hours on 7d.
Model distribution sits beside the chart. For each model with settled tokens (up to 12) it shows the request count, the share of tokens, the token total and the cost, with a bar in the colour of the model’s chart column.
Model colours match across chart columns, distribution bars and the squares beside recent model names within the selected window. Squares follow Observatory’s existing chart palette; models outside that palette use a neutral colour.
Recent outcomes
Section titled “Recent outcomes”Model names throughout Observatory use the catalog’s human-readable display name, falling back to the model code when unavailable. Chart and distribution totals remain separated by model code, even when display names match.
The table shows requests admitted in the last 60 minutes, newest first, independently of the selected chart window. It loads 200 requests at a time; Load older requests adds more from the same hour. Desktop rows keep the request details on one line; narrow screens use labelled cards. At smaller widths the client column is hidden to keep tokens and cost visible:
| Column | Content |
|---|---|
| Time | The admission time of the request, in UTC. |
| Model | The model, then the reasoning effort after a dot, and an inline speed indicator: one bolt for normal speed, two for the fast priority tier, three for ultrafast. |
| Activity | Catalog, Usage, Generation, Compaction, Files or Transcription. Unclassified calls show Other. |
| Client | A recognized client name with its icon. Unrecognized clients show the compact User-Agent (product and version when available, at most 72 characters) with a generic icon. Missing values show Unknown client. |
| Status | The outcome: Succeeded, Failed or Rejected with a sanitized reason (Rate limited, Authentication issue, Timed out, Service unavailable, Invalid request or Request failed), Accepted, In progress or Client cancelled. |
| Tokens · Cache | The total and the cached share of input, such as 47.4k 98.6%. The percentage is omitted when the recorded breakdown is incomplete. |
| Cost | The settled or estimated cost, or a dash when none is available. |
Catalog, Usage and Files show Not applicable in Model, without reasoning effort or speed indicators. Generation, Compaction and Transcription retain the recorded model or Unknown model when unavailable. Consecutive token-free utility calls with the same activity, model label, status and client fold into one Not applicable · N requests row showing the newest time. Unclassified model-free calls can also group, retaining Unknown model; model-dependent calls remain separate. Refreshing starts a new hour snapshot and replaces any older pages already loaded.
A failed request classified as Client cancelled can reflect an explicit stop, automatic client interruption, or connection loss. The label alone does not identify the cause or prove user intent; a recorded server idle timeout stays a failure. The success rate excludes client cancellations from its succeeded and failed counts, and its detail line says how many there were.
Delivery outcome and accounting are separate. Measured usage retained for a failed or client-cancelled request still contributes to token and cost totals when settled; an accounting correction does not make that response a success. Known zero usage is a measured value. Without measured usage evidence, usage remains unknown; an omitted counter alone does not establish that state. A provisional estimate is not measured usage. Usage never received by Codex Pooler cannot be inferred from a cancellation. The request-log usage states explain these distinctions.
Rejected requests appear as Rejected with a sanitized failure reason and count as failures. Requests admitted while their execution reservation is pending appear as Accepted; requests already executing appear as In progress.
The page refreshes while visible. You can pause and resume refresh, and a hidden or disconnected browser stops periodic refreshes until it becomes visible or connected again. The dashboard displays explicit loading, empty, partial-accounting, stale, disconnected, and temporary-error states instead of filling gaps with invented values.
Key-local and sanitized by design
Section titled “Key-local and sanitized by design”Every value is anchored to the authenticated API key. The Observatory does not combine data from another key, another Pool, or a separate administration view. It does not show prompts, completions, request or response bodies, file or media contents, headers, cookies, bearer credentials, raw idempotency keys, IP addresses, raw user agents, upstream identities, or raw error text.
Costs are usage-reporting values, not provider invoices. A value may be settled, estimated while accounting completes, or unavailable when pricing or accounting data is missing.
When access ends
Section titled “When access ends”The dashboard session is separate from the runtime credential and lasts at most 14 days without idle renewal. A key or Pool lifecycle change can end the session and return the browser to the login page. This includes pausing, revoking, rotating, deleting, or expiring the key; disabling Dashboard access; disabling or archiving the Pool; or moving the key to another Pool. After access is restored, sign in again with the currently valid raw key.
If the login form reports The API key is invalid or unavailable., ask the key manager to confirm that the key is active, unexpired, attached to an active Pool, and enabled for Dashboard access. The message is intentionally generic and does not identify which eligibility check failed.