Grafana dashboards
The starter dashboard brings application traffic, gateway pressure, database timing and Kubernetes resources into one view. Use it to find correlated changes before investigating individual requests.
Download the runtime triage dashboard JSON
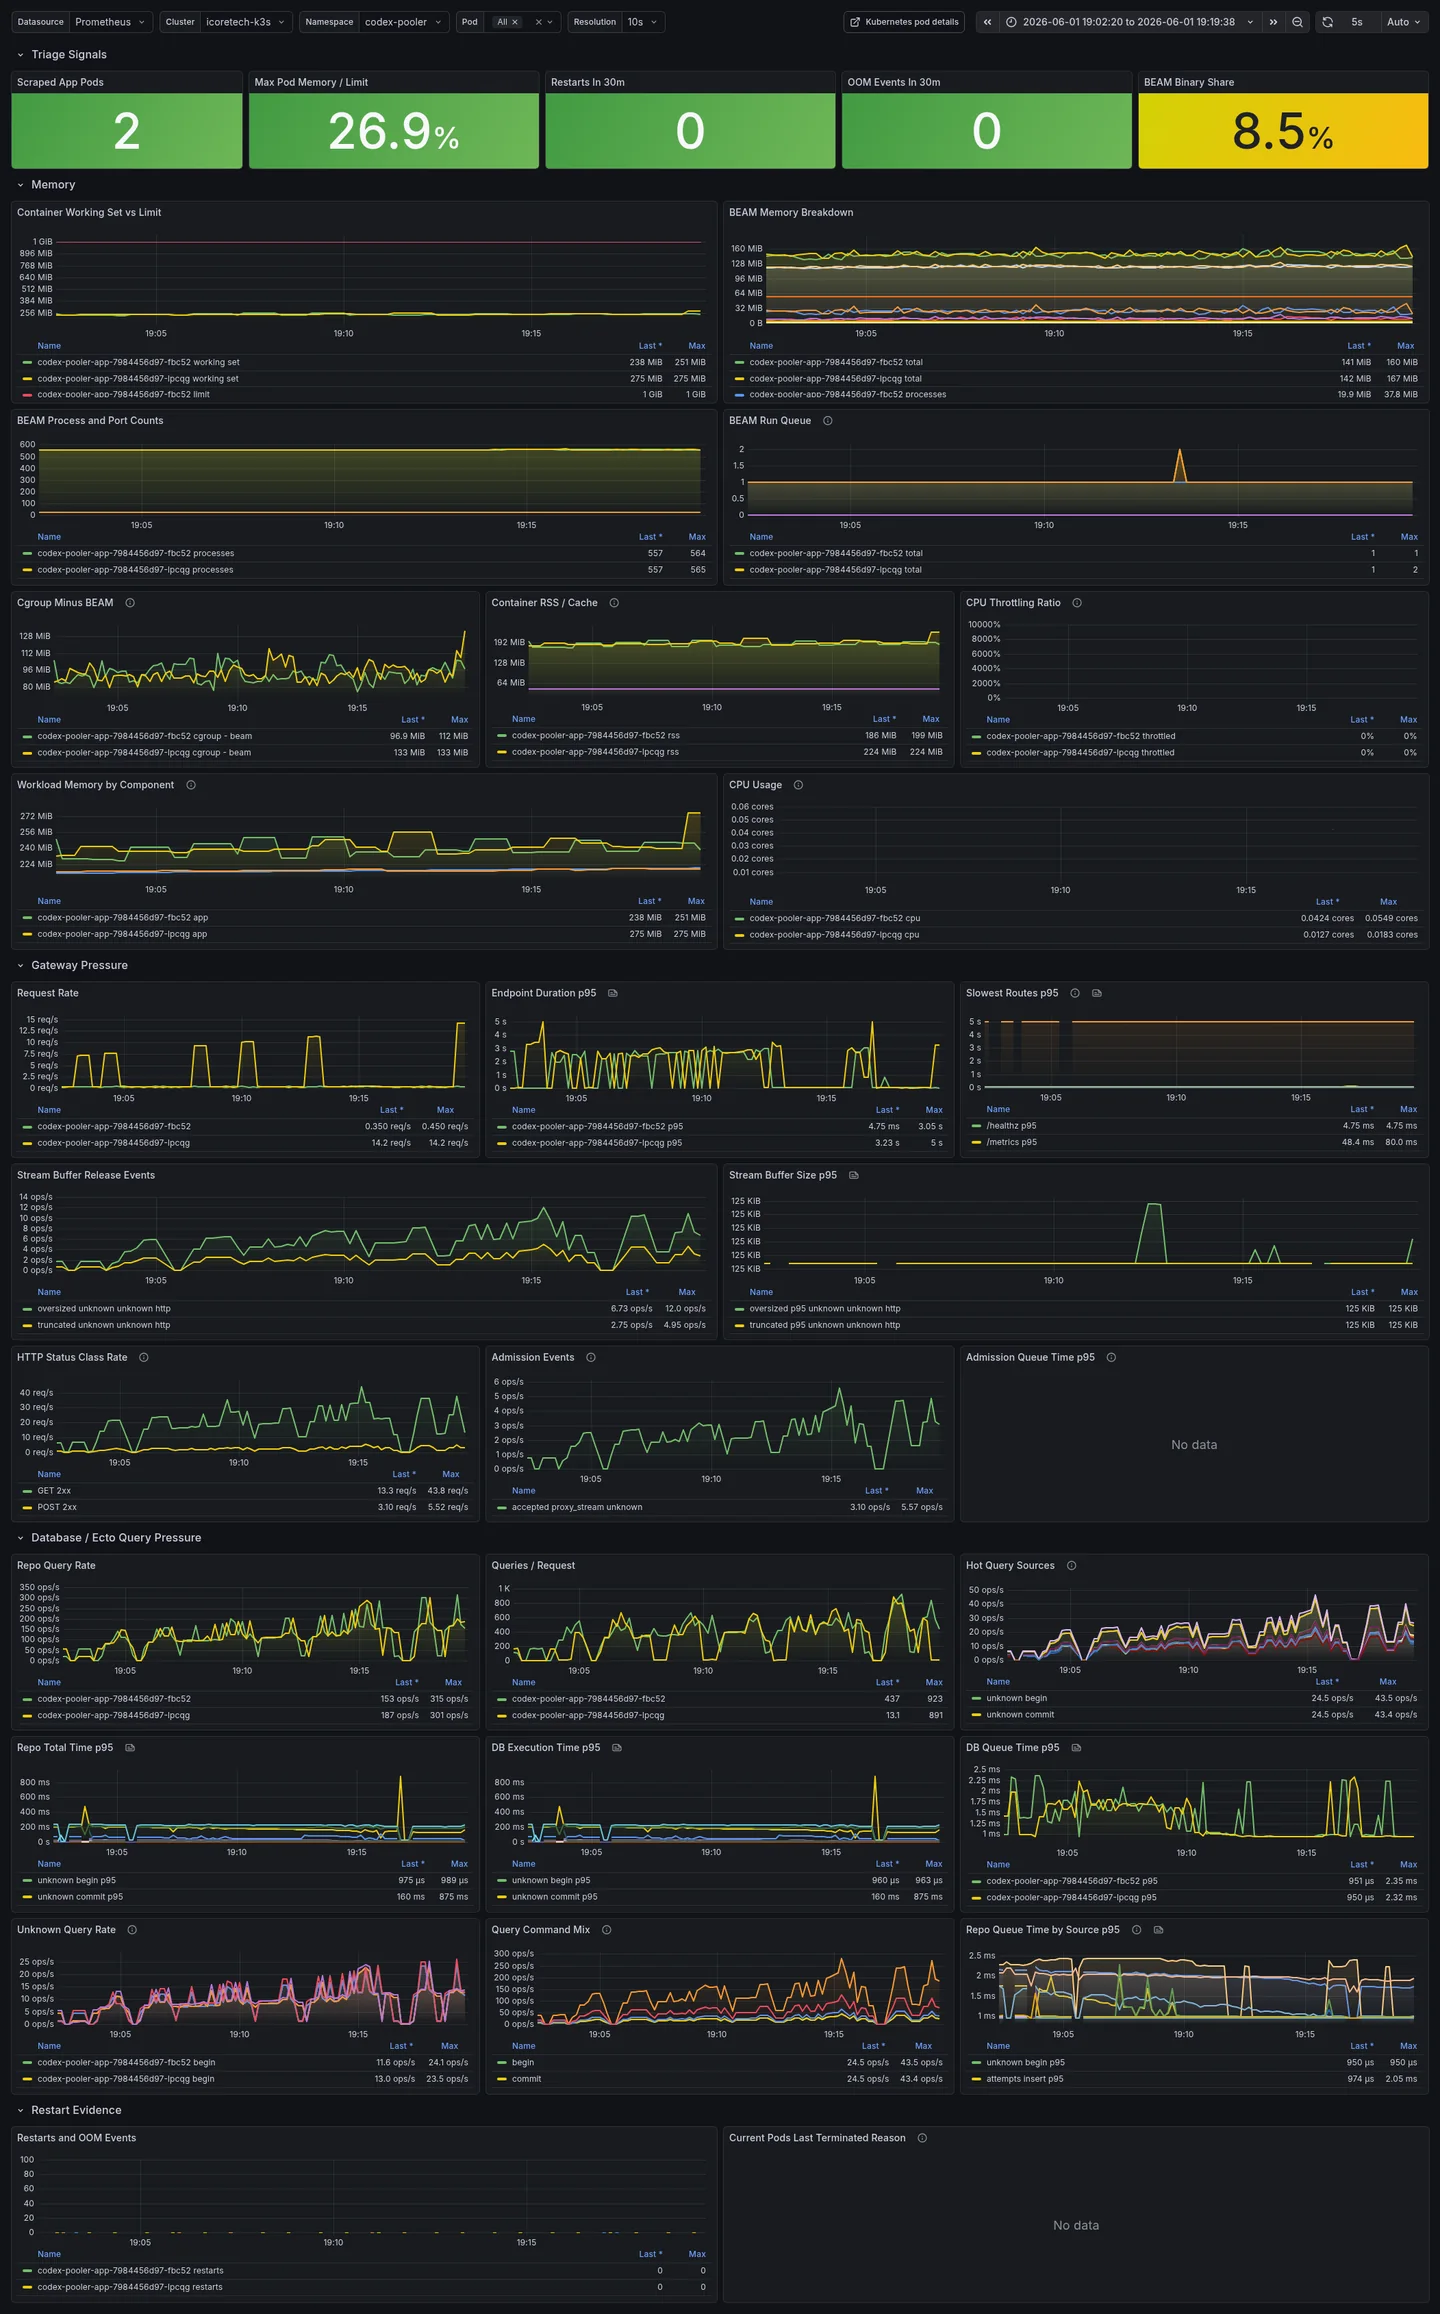
The image is an illustration. The downloadable JSON defines the panels available for import; importing or upgrading Codex Pooler does not update an existing Grafana dashboard automatically.
Before you import
Section titled “Before you import”You need a Grafana instance and a Prometheus data source collecting:
| Collector | Panels it supports |
|---|---|
Codex Pooler application /metrics |
Requests, latency, gateway queues, BEAM memory, database timings, routing and selected lifecycle events |
| Kubelet/cAdvisor | Container memory, CPU usage and throttling |
| kube-state-metrics | Kubernetes resource limits, restarts and termination reasons |
A Docker Compose deployment can use the application panels. Kubernetes panels need the Kubernetes collectors and their labels; without them those panels will be empty.
Import and select your targets
Section titled “Import and select your targets”- Open Grafana’s dashboard import flow and upload the JSON.
- Select your Prometheus data source for the Prometheus input.
- Choose the Cluster, Namespace and Pod filters.
- Check Scraped App Pods against the targets you expect.
- Open a time range containing known traffic and verify a request or latency panel.
The template assumes application targets with job="codex-pooler-app" and Kubernetes namespace/pod labels. The Cluster variable uses kube_node_info. If your collector uses different names or has no cluster label, adjust the dashboard variables and affected selectors to match.
Some kube-state-metrics setups expose the workload container as exported_container because the scrape target already has a container label. The template uses that form in restart queries. Inspect your series before changing a selector.
Read the dashboard by question
Section titled “Read the dashboard by question”| Question | Dashboard rows or panels |
|---|---|
| Is a replica close to its memory limit? | Triage Signals, Memory, Restart Evidence |
| Is traffic exceeding available request slots? | Gateway Pressure, Admission Events, Admission Saturation |
| Is waiting for PostgreSQL causing delay? | Database / Ecto Query Pressure, DB Queue Time p95 |
| Are admin pages generating unexpected load? | Admin Stats Dashboard, Admin Request Logs panels |
| Are streams failing or reconnecting? | Gateway Outcomes, Websocket Control Path Failure Rate |
| Are saved resets taking longer to finish? | Saved-reset Post-consume Convergence |
| Is background telemetry being delayed or lost? | Job Telemetry Relay |
Compare memory signals
Section titled “Compare memory signals”Compare container working set with its memory limit, then with BEAM total memory. BEAM is the Erlang runtime running Codex Pooler.
- If container memory rises while BEAM stays flat, investigate memory outside normal BEAM heap accounting and the container’s other processes.
- If BEAM binary memory rises too, inspect streaming and transport retention alongside memory sampler logs.
- If process counts, ports or run queues rise, look for accumulating work and overloaded replicas.
The cgroup-minus-BEAM graph is a correlation aid, not an exact leak measurement: the two sources account for memory differently and are sampled at different times.
Compare queues and database timing
Section titled “Compare queues and database timing”Admission running/queued gauges are local to each application pod and route class. Inspect the per-pod distribution before adding capacity: a healthy total can hide one saturated replica.
Database queue time measures waiting for a connection. Query execution time measures work inside the database. A high total query duration can contain either, so compare the panels rather than assuming every slow request is a slow SQL statement.
Interpret outcomes and coverage
Section titled “Interpret outcomes and coverage”Stream outcomes separate succeeded, failed, settlement_failed, interrupted and unknown. Client disconnects and loss of a Pooler owner can both produce interrupted; it is not synonymous with a user pressing Stop. settlement_failed is attempt-scoped, so multiple failing settlement attempts are not necessarily multiple user turns.
Read the OBAN_MODE caveats on the selected background-event panels. The starter keeps their direct via="in_process" share separate from the best-effort relay. See metrics coverage before interpreting a flat graph as zero activity.
Oversized stream-buffer observations are capped at 128 MiB for the exported histogram. Its p95 cannot describe the full size of an observation beyond that cap.
When a panel is empty
Section titled “When a panel is empty”Check the data source, time range and filters first. Then inspect the query in Prometheus:
- No target: fix metric collection.
- Target present but down: resolve the scrape error.
- Missing Kubernetes series: check kubelet/cAdvisor or kube-state-metrics.
- Missing event series: confirm that the event occurred and that the emitting role is covered.
- p95 with no observations: there is no latency sample for that window; it is not a zero-duration operation.
Use PromQL recipes for focused checks and runtime triage to interpret individual warning signals.